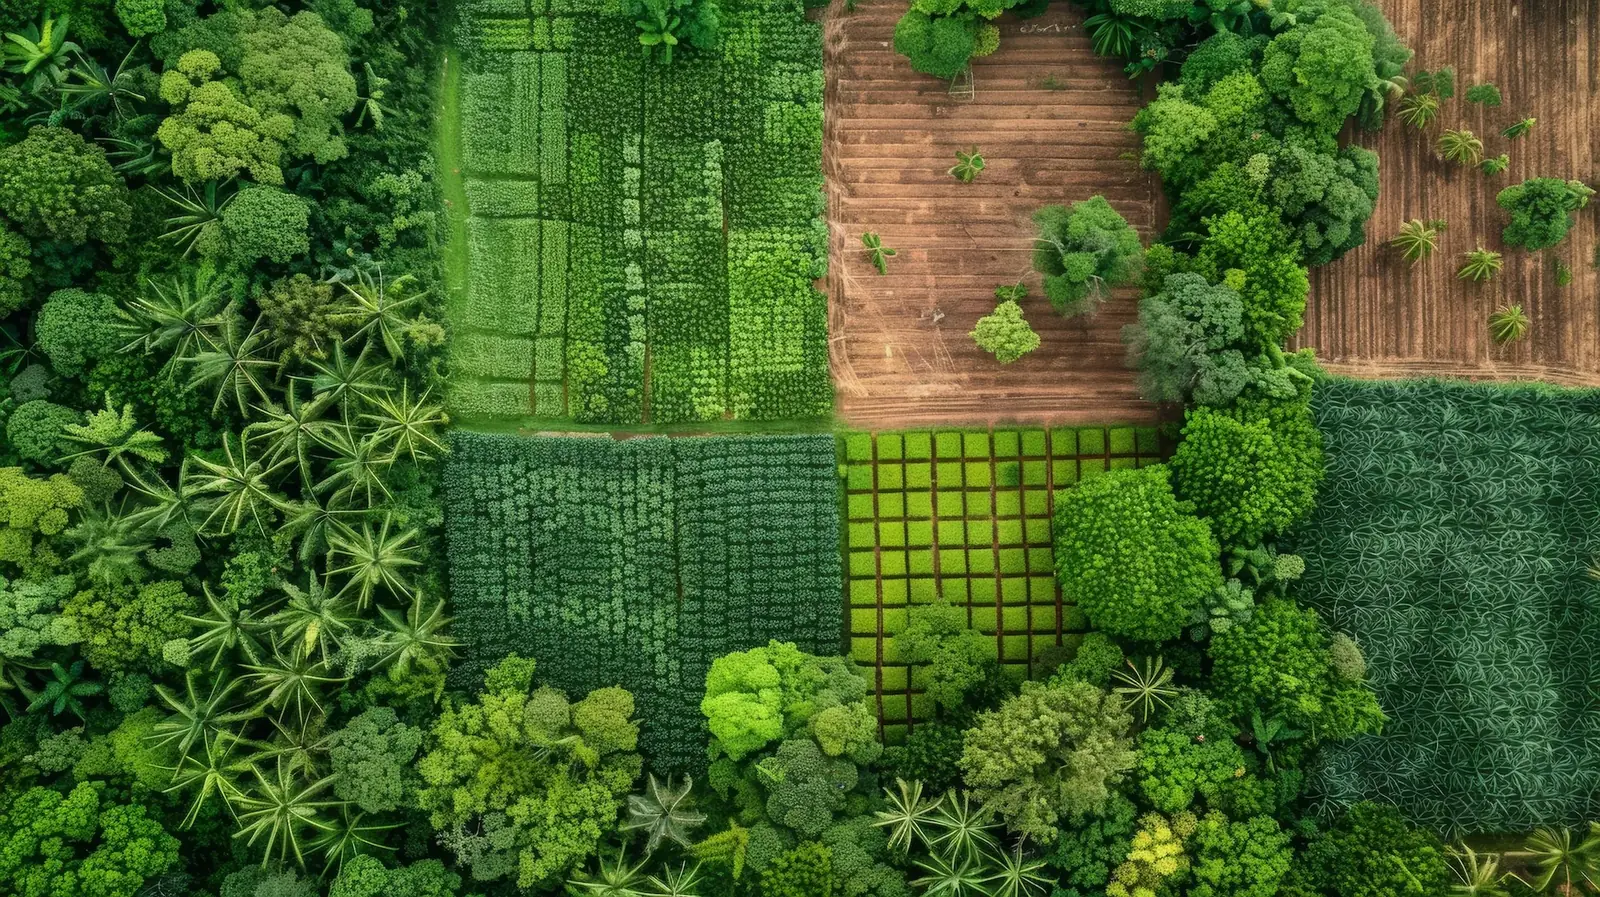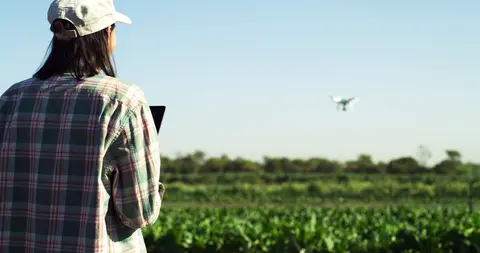
Drone crop scouting shows you the whole field at once. Patterns of water stress, nitrogen deficiency, poor emergence and spreading leaf disease appear on one map, often days before a person walking a W-shaped route would cross them. What the map does not show is the cause.
That is the central point of this guide: a drone finds where to look, and walking finds what is wrong. The farms that get value from imagery treat each flight as a plan for a shorter, better-aimed walk. Used that way, they often pay.
What does a drone flight show that walking the field does not?
A drone flight shows how a problem is distributed across every part of the field, and with the right sensor it can show some stress before leaves change colour. A walking scout samples points; a drone records every plant.
In a 2018 study in Nature Plants, Zarco-Tejada and colleagues at the European Commission's Joint Research Centre used hyperspectral and thermal cameras to detect Xylella fastidiosa infection in olive trees in southern Italy before symptoms were visible, with accuracy above 80% when confirmed by laboratory tests. The survey used a small aircraft; the authors note the method suits drones.
A 2023 study in Remote Sensing flew a multispectral drone over spring wheat in Chacabuco, Argentina, during the 2021 season. It detected yellow rust with 60% accuracy at 40 days after sowing, rising to 77% by flowering, and identified a window in which acting could preserve 3–7% of yield. At CIMMYT's Agua Fría station in Mexico, Loladze and colleagues (2019, Frontiers in Plant Science) found that drone vegetation indices and canopy temperature tracked tar spot complex in maize, a disease that cut yield by up to 58% in the most susceptible hybrids.
A 2022–2024 trial by the Borlaug Institute for South Asia and IRRI in Bihar, India, mapped water stress and nitrogen deficiency in rice and wheat the same way.
The problems drones tend to catch earlier than a walk:
- Water stress and irrigation failure: a stressed canopy runs warmer, which a thermal camera records before wilting.
- Nitrogen deficiency in patches: red-edge and near-infrared bands show chlorophyll loss across a zone.
- Waterlogging and drainage faults: low spots show as clear shapes from above.
- Emergence gaps: missing rows are obvious on a map and easy to miss on foot.
- Patchy foliar disease: rusts and leaf spots form clusters that grow from one flight to the next.
What does drone imagery miss?
Drone imagery misses anything that does not yet change the top of the canopy, and it never tells you the cause. Insects are the clearest case. In a June 2014 trial at Oregon State University's Hermiston station, USDA-ARS and university researchers flew ten flights over 15 days above potatoes infested with Colorado potato beetle. Imagery taken the day before damage appeared showed nothing. Damage became visible within a single day, and the drone detected it only on that day (Hunt and Rondon, Journal of Applied Remote Sensing, 2017).
The lower canopy is a second blind spot. A 2022 study in Pest Management Science by USDA-ARS researchers in Hawaii compared drone and ground estimates of macadamia felted coccid damage. For one cultivar, ground scouts recorded more damage than the drone, because early dieback started low in the tree where the camera could not see it.
Three further limits:
- Cause: a low index can mean nitrogen shortage, drought, disease, compaction or herbicide injury; only a ground visit or sample separates them.
- Pests and eggs under leaves: aphids, mites and egg masses need a hand lens.
- Below-ground problems: nematodes and root rots show only as late canopy symptoms.
Which flight parameters decide whether imagery is usable?
Imagery is usable only when overlap, altitude, sun angle and calibration are consistent from one flight to the next.
| Parameter | Typical setting | Why it matters |
|---|---|---|
| Front and side overlap | 75% for multispectral sensors (MicaSense guidance); 80% in many RGB workflows | Less overlap leaves gaps and stitching errors |
| Altitude and pixel size | 30 m gave 15 mm pixels and 60 m gave 30 mm in the 2014 Oregon trial; legal ceiling 120 m (EU) or 400 ft, about 122 m (US) | Pixels should be at most half the size of the target |
| Terrain | Plan from the highest point; avoid more than 30 m elevation change per flight | Overlap is set from take-off height, so it drops on higher ground |
| Time of day | Within 2 to 2.5 hours of local solar noon | Shadows distort indices; thermal readings drift through the day |
| Light and calibration | Reflectance panel before and after every flight; avoid broken cloud | Otherwise a change in sunlight looks like a change in the crop |
| Repeat conditions | Same time, height and settings each flight | Comparison between dates is the main output |
Agricultural drone regulations by region
In most major regions, flying a camera drone to scout crops needs registration and a basic pilot qualification, while spraying from a drone is regulated as aerial application and needs much more.
| Region | Scouting and mapping flights | Spraying and spreading |
|---|---|---|
| United States | FAA Part 107: registration, remote pilot certificate, below 400 ft (about 122 m), visual line of sight | Part 137 certificate plus exemptions; drones of 25 kg (55 lb) or more under Parts 91 and 137; state applicator licence |
| European Union | Regulation (EU) 2019/947, in force since 31 December 2020; most scouting fits the low-risk "open" category | Always the "specific" category; EASA extended scenario PDRA S-01 to agriculture in 2023; EU pesticide law also requires a derogation for aerial spraying |
| Brazil | ANAC registration and ANAC and DECEA airspace rules | MAPA Ordinance 298 (September 2021): MAPA registration, an approved course, and records with an application map and agronomic prescription |
| India | Drone Rules 2021: Digital Sky registration; DGCA Remote Pilot Certificate valid 10 years | CIBRC-approved pesticides only; 2022 subsidies of 50%, up to ₹5 lakh, for some farmer groups |
| Kenya | Civil Aviation (UAS) Regulations 2020, in force April 2020; risk categories A, B and C; KSh 3,000 registration | Commercial operators need a KCAA Remote Aircraft Operator Certificate |
Rules change often; confirm with national authorities before each season.
Does drone crop scouting pay at typical field sizes?
Drone scouting pays when the total cost per hectare of flying, processing and walking to the flagged zones is lower than the loss it helps you avoid. Most of the cost is fixed, so field size decides.
In an August 2026 Iowa Learning Farms webinar, Rutgers University extension economist Sophie Lee costed an RTK multispectral scouting system at about US$4,900 to start, including licensing and software. For 121 ha (300 acres) with 13 flights, 3 hours per round, labour at US$20 per hour, US$1 per acre for maintenance and 7% interest, the annual cost was about US$2,800. That is US$22.66 per hectare (US$9.17 per acre) per season. Lee found that at 61 ha (150 acres), most farms would struggle to justify ownership within five years.
Processing time is small: University of Arizona Extension (publication az2031, 2023) reports software processing a 40 ha (100 acre) field in under 30 minutes. The real processing cost is the software subscription, which is the same for 2 ha or 200 ha. The same publication prices custom NDVI imagery at US$6–9 per acre, about US$15–22 per hectare.
Worked example. Take a maize field yielding 6 t/ha, sold at an assumed US$200/t, so US$1,200/ha gross. At Lee's 121 ha cost of US$22.66/ha, the flights must prevent a loss of about 113 kg/ha, or 1.9% of yield. The 3–7% recoverable window in the Argentina yellow rust study clears that bar, but only if each flagged zone is walked and acted on quickly.
Now apply Lee's figures to one 2 ha field. Her annual cost includes about US$780 of labour and US$300 of maintenance, which leaves about US$1,720 of fixed cost. With a shorter 1-hour round, the season costs about US$1,990, or roughly US$990/ha. That is most of the field's US$1,200/ha gross income.
Small fields are common: Lesiv and colleagues (2019, Global Change Biology) estimated that fields under about 2 ha cover 40% of the world's agricultural area. For these farms, ownership does not pay. A shared service does: a cooperative, input dealer or trained lead farmer flying many neighbouring fields in one session brings the cost near the US$15–22/ha service range.
FAQ
How high should I fly a drone for crop scouting?
For most field crops, fly 30–120 m above the canopy, choosing the height that gives pixels no larger than half the feature you need to see. Stay below 120 m in the EU and 400 ft (about 122 m) in the US.
Can a drone replace walking the field?
No. A drone shows where the crop is changing, often before a walking scout would reach that area, but it cannot name the cause. Insects, eggs under leaves, lower-canopy damage and root problems still need a person on foot. Use each map to shorten and aim the walk.
Is NDVI enough to diagnose a crop problem?
No. NDVI measures canopy vigour, so a low value can mean nitrogen shortage, drought, disease, compaction or herbicide injury. Thermal and red-edge data narrow the options, but a soil test, tissue sample or field inspection is still needed before you apply fertiliser, water or a pesticide.
With Valora Earth, a lead farmer standing in a zone the drone flagged can describe what they see by voice on WhatsApp, in their own language, and get agronomic guidance for that field.